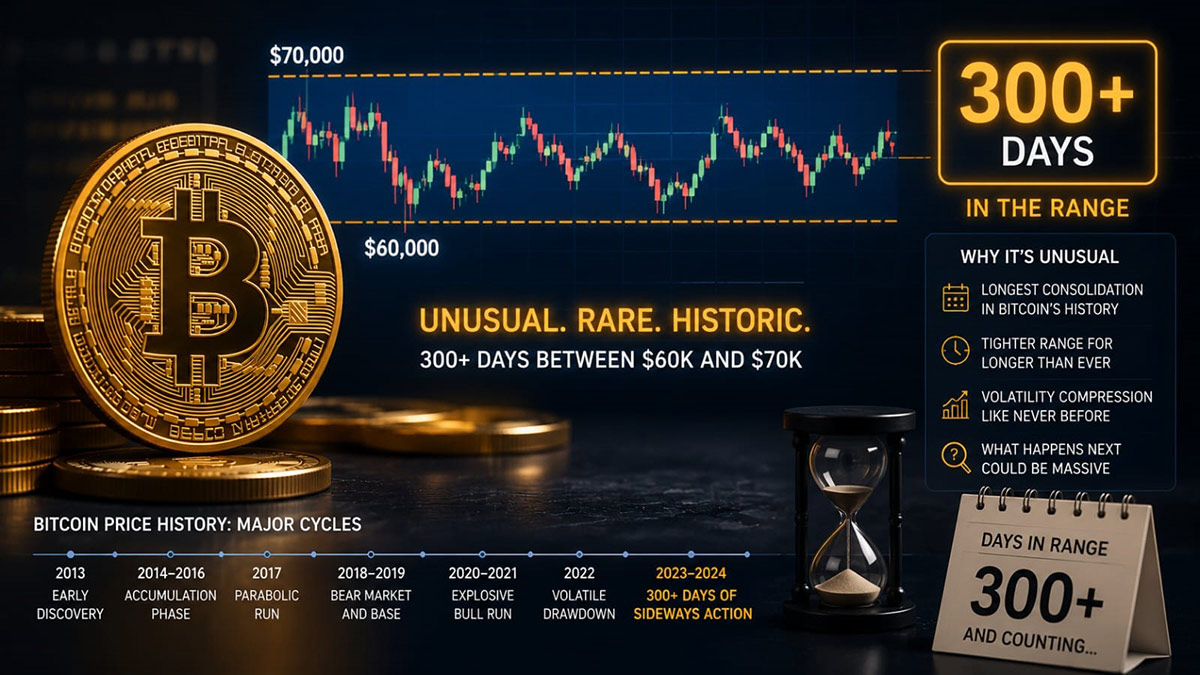
Bitcoin has now spent over 300 days trading between $60,000 and $70,000 — one of the longest consolidation periods in its history. Here's what that pattern has meant in the past, and what tends to happen when it finally breaks.
Bitcoin's price has done something unusual this year: mostly nothing dramatic. While headlines have covered plenty of day-to-day volatility, zoom out and a different picture appears — Bitcoin has now spent more than 300 days trading within the $60,000–$70,000 band, making it the third-longest consolidation range in the asset's entire trading history. For an asset best known for wild swings, that kind of extended sideways action is worth understanding.
What "consolidation" actually means
A consolidation range is a period where an asset's price trades repeatedly between a defined floor and ceiling, without a decisive break in either direction. It reflects a rough equilibrium: enough buying pressure at the lower bound to prevent a deeper breakdown, but not enough conviction to push through resistance at the top. Traders often read long consolidation periods as a market waiting for a catalyst — new information significant enough to tip the balance one way or the other.
How this range has actually played out
The past several months illustrate the pattern well. Bitcoin fell as low as the high-$50,000s during a sharp mid-year sell-off, then rebounded above $61,000 on softer-than-expected inflation commentary from the Federal Reserve. It dipped again on geopolitical shocks — including a bout of selling after US airstrikes on Iranian targets rattled risk assets broadly — before recovering within days. By early July, Bitcoin was testing the mid-$64,000s again, retesting levels it had failed to clear just days earlier.
That back-and-forth is exactly what a consolidation range looks like up close: each dip finds buyers, each rally finds sellers, and the asset keeps returning to the same broad territory rather than establishing a new trend.
Why this range has held for so long
A few forces appear to be keeping Bitcoin anchored in this band:
- Institutional buying offsetting ETF selling. Spot Bitcoin ETFs have seen meaningful net outflows for stretches of this year, but that selling has been substantially offset by corporate treasury companies continuing to accumulate — a different type of buyer with a longer time horizon than typical ETF investors.
- Macro uncertainty cutting both ways. Interest rate expectations, inflation data, and geopolitical events have each pushed price in both directions at different points, without any single catalyst decisive enough to break the range outright.
- Pending regulation. Market structure legislation — commonly referred to as the CLARITY Act — has been anticipated for much of the year without reaching a final vote, leaving a major potential catalyst still on the table rather than already priced in.
What tends to happen after long consolidations
Historically, extended consolidation ranges in Bitcoin's price history have tended to resolve with a larger move than the choppy trading during the range itself would suggest — the logic being that the longer buyers and sellers are evenly matched, the more pent-up pressure builds for whichever side eventually wins out. That's a historical pattern, not a guarantee, and it says nothing about which direction the eventual break favors.
It's also worth being cautious about over-reading any consolidation range in real time. They can persist far longer than traders expect, and calling the "top" or "bottom" of a range prematurely is one of the more common ways traders get caught offside.
What to watch from here
A few developments could plausibly serve as the catalyst that finally breaks this range: a decisive move on crypto market structure legislation, a shift in Fed policy expectations, or a meaningful change in the pace of either ETF flows or corporate treasury buying. Until one of those materializes, the most likely near-term scenario is more of the same — continued chop within a well-established band, rather than a clean trend in either direction.